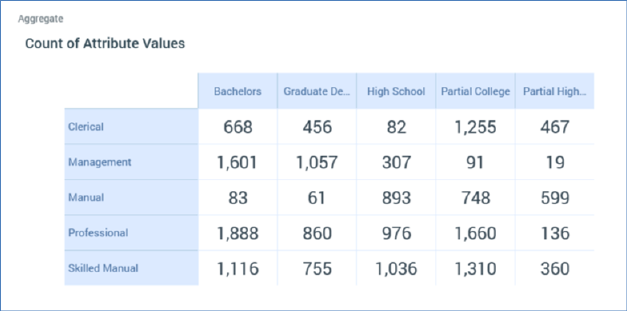
An RPI crosstab allows you to cross-tabulate two attributes against one another and view the resultant counts at attribute value intersections as cells within a grid:
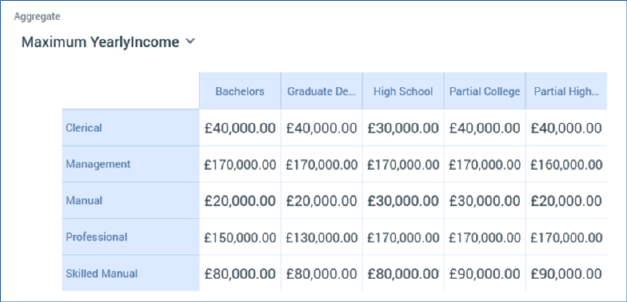
A crosstab also allows you to glean insights in respect of a third, ‘Function’, attribute, which can be aggregated in the context of each cell to produce a count value:
A crosstab consists of the following elements, each of which is documented separately:
•Resolution/Definition
•Toolbox
•Chart Tab
•Table Tab
•Actions Menu