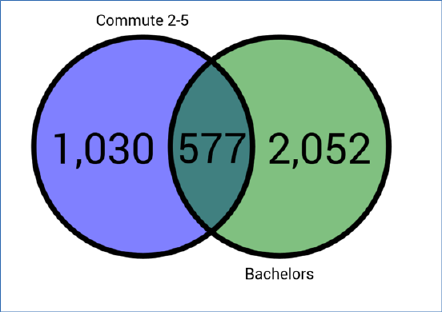
A two-or-three set Venn diagram is displayed to the right of the toolbox:
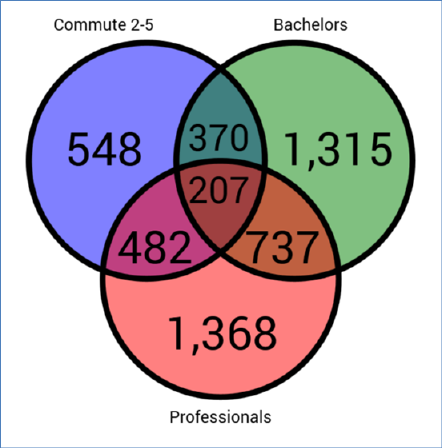
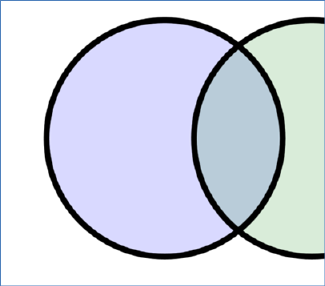
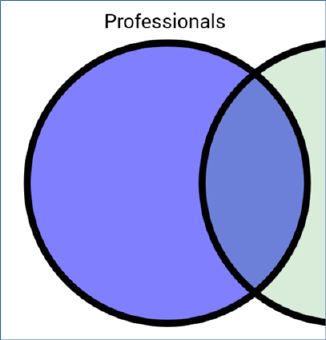
A colored circle is displayed for each Venn set. The circle’s color is intensified when it is configured with a selection rule:
Once a Venn diagram’s counts have been displayed, hovering over a Venn set (or an intersect within the diagram) displays the hovered context in the lighter color.
When you hover over a Venn set with a dragged selection rule, the Venn set is temporarily blanked:
Dropping at this point configures with Venn set in question with the selection rule.
When you open a Venn diagram, if results had been generated previously, the most recently-generated version thereof is displayed automatically at the panel. For more information on previously-generated results, please see the Chart Workspace documentation.
A Venn diagram’s principal function is to provide an alternative method to building standard selection rules, other than through manual configuration.
Once you have populated Venn sets with selection rules, you can right click a segment and choose the Create new Selection Rule from Segment context menu option thus displayed.
A new standard selection rule is created and displayed in the Rule Designer. It named ‘New Venn Diagram Rule’ (an incrementing integer can be appended to the name to ensure uniqueness). The rule contains linked selection rules in accordance with the Venn set and filter selection rules that define the segment on which the selection rule is based.
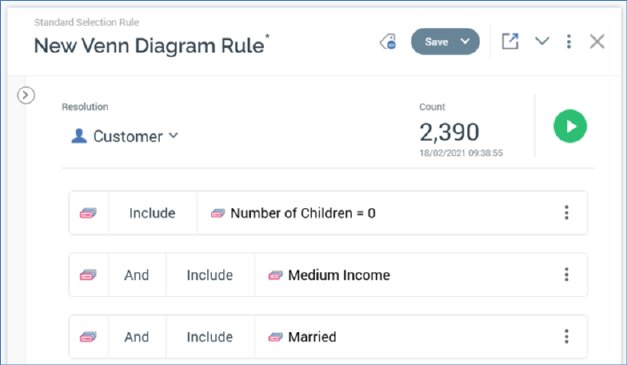
In addition, the new selection rule’s resolution level is set to the same value as the Venn diagram from which it was created (with any cross-resolution linked rules contained within criteria lists with appropriate resolution levels).