The Trace tab provides visibility of the query statements executed during audience or fulfillment activity execution.
It contains the following:
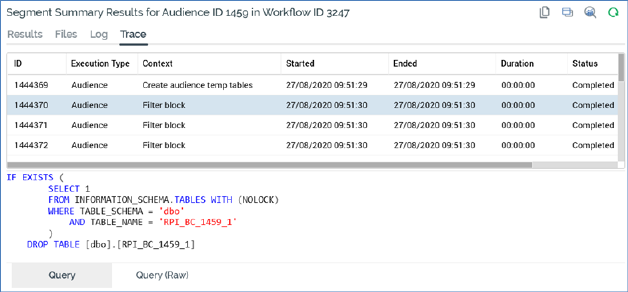
•Trace entries grid: the grid lists the individual statements that were executed when the audience or fulfillment activity ran. The following columns are shown:
o ID
o Execution type: one of Audience or Fulfillment
o Context: describing the scenario in which the query was executed
o Started: date/time
o Ended: date/time
o Duration: hh:mm:ss
o Status
o Result
Trace entries are displayed in ascending chronological order, with the earliest statements being shown first.
•Selected trace entry details: this read-only section is displayed below the grid and contains up to three tabs.
o Query: shows the detail of the statement selected currently in the grid. The query is formatted.
o Query (Raw): shows the detail of the statement selected currently in the grid. The query is unformatted.
o Error Message: this tab is only available when errors occurred during execution of the currently-selected trace log entry. Full error details are displayed.
You can copy trace statements to the clipboard using the toolbar button provided. When you do so, two hyphens are added at the beginning of any non-query lines of text. The same applies at any error messages. This makes it easier to execute any resultant SQL immediately in a SQL execution environment (e.g. SQL Server Management Studio).