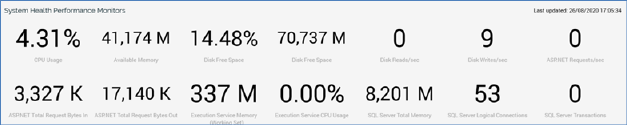
The lower half of the System Health tab displays a series of categorized metric values that provide insight into the current performance of the RPI server.
The section contains the following:
•Last updated: the date and time at which the metrics were most recently refreshed. Note that metrics are updated in real-time on invocation of the Refresh button, rather than reflecting the most recent results of execution of the System Health task
•Hardware: these metrics relate to the server hardware upon which RPI is installed. The following metrics are displayed:
o CPU Usage (%). Note the percentage shown here represents the sum of usage across all CPUs, hence the value shown may exceed 100%.
o Available Memory (M): this metric shows % Committed Bytes In Use. This represents is the ratio of Memory – Committed Bytes to the Memory – Commit Limit. Committed memory is the physical memory in use for which space has been reserved in the paging file should it need to be written to disk. The commit limit is determined by the size of the paging file. If the paging file is enlarged, the commit limit increases, and the ratio is reduced). This counter displays the current percentage value only; it is not an average.
o Disk Free Space (%)
o Disk Free Space (M)
o Disk Reads/sec
o Disk Writes/sec
•.NET: these metrics relate to the Microsoft.NET framework that underpins RPI. The following metrics are displayed:
o ASP.NET Requests/sec
o ASP.NET Total Request Bytes In (K)
o ASP.NET Total Request Bytes Out (K)
•Services: these metrics relate to the core Windows services that help comprise RPI. The following metrics are displayed:
o Execution Service (Working Set)
o Execution Service CPU Usage
•SQL Server: these metrics are only shown if the RPI data warehouse is running on the Microsoft SQL Server platform. The following metrics are displayed:
o SQL Server Total Memory
o SQL Server Logical Connections
o SQL Server Transactions
The display of SQL Server performance metrics is controlled by system configuration setting SQLPerformanceCountersEnable.
If the system is unable to retrieve data for a metric, a cross icon is shown. Failure details are shown as a tooltip when you hover over the cross.