
This section contains a toolbar, and a treeview representation of the health of the current client’s RPI installation.
•Toolbar: the System Health Overview toolbar exposes the following:
o 'System Health Task last ran: [date/time]': the date and time at which System Health information was most recently refreshed. The information displayed when you refresh System Health & Tasks reflects the state of the system at the most recent execution of the System Health Monitor task and may not reflect with 100% accuracy the current state of the system (depending on when that task ran).
o Run System Health Monitor Tasks: to gain an accurate understanding of the current state of system health, you can invoke this option, which executes the Client Health Monitor and System Health Monitor tasks. Note that the button is disabled while the task is running.
o Export System Health: invocation of this option displays the Save System Health Details Windows file system dialog, with which the Default file type is set to Text Files, the default file name to 'System Health [yyyy]-[mm]-[dd]' and the default folder to the folder within which the client application is running. You can click Save to save the system health details to a file, or you can click Cancel to close the dialog without saving.
The file thus generated contains the system health hierarchy as displayed in the System Health Overview. For each element in the hierarchy, the following are displayed:
§ Name
§ Health: one of Healthy, Warning or Attention Required
§ Description
o Refresh: clicking this button loads the most up-to-date system health information available.
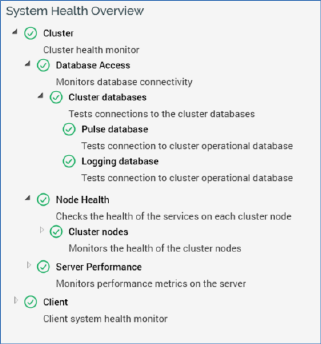
•Treeview: the System Health Overview treeview provides a series of health indicators that together provide an immediate understanding of the current state of the RPI server.
Each element in the treeview is shown as being in one of three states:
o Healthy
o Warning
o Attention Required
The overall status of a parent node is determined by the collective statuses of its descendant nodes. If all of its descendants are healthy, the parent node is deemed also to be healthy. If one or more warning descendant nodes are present, but none required attention, the parent is in a warning state. If one or more descendants require attention, the parent node also requires attention (irrespective of the presence of descendants in a warning state).
When a leaf node is in a warning state or requires attention, when you click it, a checkbox is displayed:
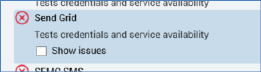
Checking the checkbox displays the issue’s details:
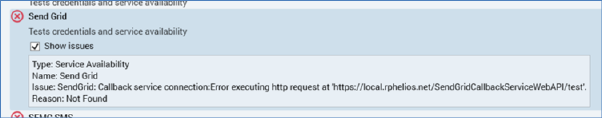
If you highlight another treeview node, the issue’s details are removed from display. They are redisplayed when you highlight the node again.
The treeview contains the following nodes:
o Cluster: this node contains details about the current state of health of the server’s cluster core. It contains the following nodes:
§ Database Access: describes the current connectivity state in respect of the following cluster databases:
•Pulse database: the cluster core’s operational database
•Logging database: the database to which log messages from across the cluster are written.
•For each Windows services role in the cluster:
o Workflow database on [server] (ID:[n]): the database in which the Windows service’s workflows are persisted.
§ Node Health: describes the state of health of the cluster’s nodes. These include the master node manager node.
§ Server Performance: monitors the current state of performance within the cluster:
•Memory usage: this test checks whether server memory use is currently below [x]%. Current value is [y]%.
•Remaining hard drive space: this test checks that the remaining server hard disk space is above [x] M. Current value is [y] M.
o Client: this node describes the state of health of the current client. The following are monitored:
§ AML Service: this node describes the current status of RPI’s connection to the Redpoint Automated Machine Learning (AML) API.
§ External Services: this node describes the availability of third party services used by the client (channels, FTP locations and web adapters).
§ Database Access: tests connectivity to the following databases:
•Operational database
•Audit database
•Data warehouse
•Auxiliary database(s) (if configured)
§ Realtime Service: this node describes the current state of the current RPI Realtime service.
§ File Access: this node describes the current state of access to local and network file systems, specifically to the system output folder.