A selected item details panel is displayed to the right of the treeview. It displays details of the currently-selected treeview item. Its contents are dependent on the type of item selected.
If an interaction, audience or data connector is selected at the treeview, the panel contains:
•Icon: indicating the file’s type
•File name
•Description
•First activated: ‘The date and time at which a workflow within the file commenced execution’
•Workflows (active): ‘The count of workflows within the file that are currently in an active state (e.g. Playing or Paused)’
•Workflows (executed): ‘The count of workflows in the file that have executed at least once’
•Most recent activity: ‘The most recent date and time at which execution of a workflow activity occurred’
•Activities (active): ‘The count of workflow activities in the file that are currently in an active state (e.g. Playing or Paused)’
•Activities (executed): ‘The count of workflow activities in the file that have executed at least once’
•A toolbar, exposing the following options:
o Open latest version: invocation displays the file in its relevant designer.
o Open file location: invocation displays the contents of the RPI file system folder in which the file is persisted in the File System Dialog and highlights the file in question.
•Audit log: this section displays all audit log entries relevant to file in question
o View in Audit Log tab button: displays the Operations Audit Log interface, filtering its contents to show only audit records relevant to the file in question.
•Pulses: displays all pulses related to the current file, including system-generated pulses. Pulses are listed in reverse chronological order. Only displayed if system configuration setting EnablePulseMessages is set to True.
o View in Pulses window button: invocation of this option displays the Pulses Window, in which pulses related to the current file are listed.
If a workflow is selected at the treeview, the panel contains:
Workflow icon: the icon’s color indicates its mode of execution, and its halo provides status information.
•Trigger name
•Status
•Activated in Test | Production Mode
•First activated: ‘The date and time at which the workflow commenced execution’
•Activities (active): ‘The count of activities in the workflow that are currently in an active state (e.g. Playing or Paused)’
•Activities (executed): ‘The count of activities in the workflow that have commenced execution’
•Most recent activity: ‘The most recent date and time at which execution of an activity within the workflow occurred’
•Workflow instance ID (most recent): ‘The unique ID of the most recently-created instance of the workflow’
•Duration: ‘Total workflow duration from initial activation to most recent activity’
•A toolbar, exposing the following options:
o Change status to: a dropdown, exposing the following values:
§ Completed
§ Not started
§ Paused
§ Stopped
o Change the status of the Workflow Instance to the selected status: invocation of this option displays the following dialog:
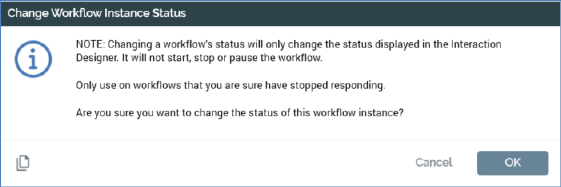
If you elect to proceed, the workflow instance’s status is set to the value selected at the Change status to dropdown.
o Open Workflow Instance: displays the workflow instance in the Workflow Instance Viewer.
•Audit log for [File Name]: this section displays all audit log entries relevant to the current workflow's file.
o View in Audit Log tab button: invocation displays the Operations Interface’s Audit Log tab, filtering its contents to show only those audit records relevant to the current workflow’s file.
•Pulses for [File Name]: this section displays all pulses related to the current workflow's file, including system-generated pulses. Pulses are listed in reverse chronological order. The section is only displayed if system configuration setting EnablePulseMessages is set to True.
o View in Pulses window button: invocation of this option displays the Pulses Window, in which pulses related to current workflow's file are listed.
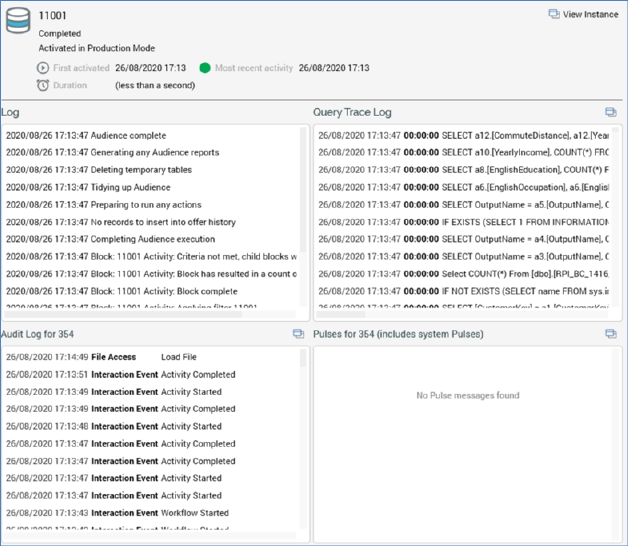
If an activity is selected at the treeview, the panel contains:
•Icon: activity type-specific, with a halo that provides status information.
•Activity name
•Status
•Activated in Test | Production Mode
•First activated: ‘The date and time at which the activity commenced execution’
•Most recent activity: ‘The most recent date and time at which execution of the activity occurred’
•Duration: ‘Total activity duration from initial activation to most recent occurrence therein’
•A toolbar, exposing the following option:
o View Audience Instance: this option is only available when a batch audience or interactive activity configured with an audience is selected at the treeview. Invocation displays the audience instance in the Audience Instance Viewer.
•Log: this panel displays log messages related to the activity's execution. Messages are presented in reverse chronological order.
•Query Trace Log: this panel displays Query Trace log messages related to the activity's execution. Messages are presented in reverse chronological order. For each, the date/time, duration and SQL statement are shown.
o View in Query Trace Log tab: invocation of this option displays the Operations Interface’s Query Trace Log tab, filtered to only display Query Trace records relevant to execution of the activity in question.
•Audit log for [File Name]: this section displays all audit log entries relevant to the current activity's file.
o View in Audit Log tab button: invocation of this option displays the Operations Interface’s Audit Log, filtered to only display audit records relevant to the activity’s file.
•Pulses for [File Name]: this section displays all pulses related to the current activity's file, including system-generated pulses. Pulses are listed in reverse chronological order. The section is only displayed if system configuration setting EnablePulseMessages is set to True.
o View in Pulses window button: invocation of this option displays the Pulses Window, in which pulses related to current activity’s file are listed.