
When initially displayed, the following message is shown at a pivot table:
When a pivot table has been refreshed, and its results displayed, the following are shown:
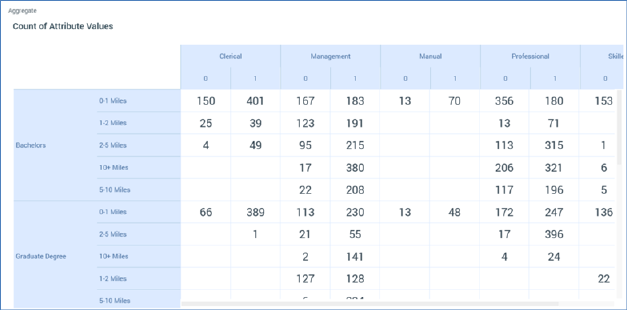
•Aggregate: set to the current Aggregate’s name. If more than one aggregate was checked, you can select which to view by clicking the title and selecting from a dialog:

•Column headers: one column is displayed per attribute in the Columns attributes list. The position of an attribute within the Columns list determines its position within the results. The first attribute’s values are displayed once. If supplied the second attribute's values are displayed for each of the first attribute's values. The same pattern applies at the third and fourth attributes. If a column contains no results, it is not shown.
On hovering over a column header value, a tooltip displays:
o Attribute name
o Attribute value (raw database)
•Row headers: as Column headers, other than the top attribute is displayed to the left.
•Table data: a value is displayed at each cell that represents a combination of row and column values. If no data are present within a cell, it is shown as empty.
Table cell counts represent the following:
o If a Function attribute was not supplied, the cell contains the count of records at the selected resolution level that match the cell’s column and row attribute values.
o If a Function attribute was supplied:
§ If the Count aggregate is displayed, a cell shows the same value as if a Function attribute were not provided: the count of records at the selected resolution level that match the cell’s column and row attribute values.
§ If an aggregate other than Count is displayed, a cell shows the aggregated value of the Function attribute in the context of the cell’s row and column values. For example, if Function attribute Yearly income and aggregate Average are selected, a cell will display the average yearly income for its unique combination of row and column values.
A cell is selected when you hover over it. On right clicking a cell, a Create New Selection Rule from Cell option is displayed at a context menu. Invocation creates a new standard selection rule, pre-configured with criteria accordant with the cell’s Row and Column Attribute values, and displays it in the Rule Designer, after all currently-displayed rules and panels. The new rule is named ‘New Pivot Table Rule’. The option is not available when the panel is popped out.
A maximum number of 100,000 records in total, or 100 distinct values per column or row, can be retrieved when you refresh a pivot table. If a larger number than this are returned, a message is displayed at the bottom of the pivot table workspace.
When you open a pivot table, if results had been generated previously, the most recently-generated version thereof is displayed automatically at the panel. For more information on previously-generated results, please see the Chart Workspace documentation.