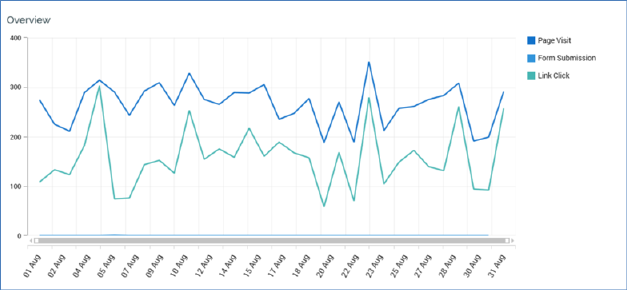
This section contains a line chart, which displays time series values relating to metrics gathered in respect of published landing pages across the currently-specified date range.
When no data are available to be shown, a message is displayed.
You can change the date range displayed within the chart by shortening or lengthening the horizontal scroll bar displayed at the bottom of the line chart manually, or by using the mouse wheel.
By default, the following series are shown:
•Page Visit
•Link Click
•Form Submission
•Targeted
Any custom web events metrics and states are also displayed if they exist, along with series representing any separately-charted items' metrics.
On hovering over the chart, a vertical line, with points marking metric series' values, is displayed at the date nearest to the cursor.
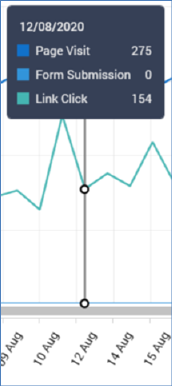
A legend at the top shows the currently-displayed series' counts for the date in question.
A legend is displayed to the right of the chart.
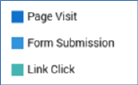
It displays each aggregated metric:
•Page Visit
•Link Click
•Form Submission
•Targeted
Custom web events states and metrics (if metric values exist) are also shown. In addition, any Separately-charted landing pages’ series are also displayed.
A tooltip is shown when hovering over a legend entry.
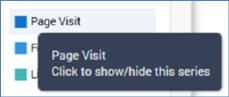
Clicking the same shows or hides the series. A series is grayed out at the legend and removed from the chart when hidden, and the vertical scale is adjusted accordingly. A series is also removed automatically at the By Item stacked bar chart in the Detailed Results (if displayed).