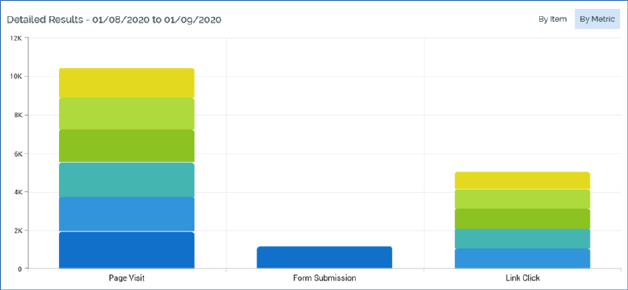
The By Metric stacked bar chart displays one stacked bar per aggregated metric, with data sourced from across the visible date range in the Overview line chart.
The following metrics are shown:
•Page Visit
•Link Click
•Form Submission
•Custom web events states and metrics (if available)
•Interaction states
A numerical count is displayed at each section within a bar (if space permits). Only checked landing pages are shown.
On hovering over a bar, a tooltip is displayed. Its contents depend on the metric in question:
•Page visit: displays the count by landing page. Entries are presented in descending value order. If more than ten values are available, the top ten values are displayed, and the sum of the remaining values shown as ‘All others’.
•Link Click: displays URLs clicked.
•Form Submission: displays the names of submitted forms.
•Web event state or metric: displays state or metric counts only.