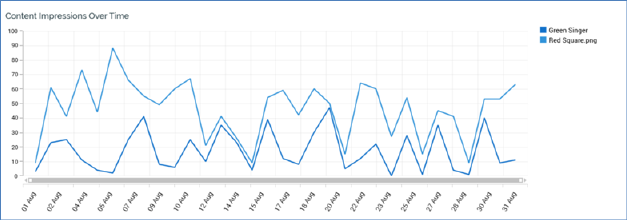
This line chart displays the trend of the selected smart asset's content elements being rendered across the selected date range.