When initially displayed, following creation or being opened, the Chart tab is blank, save for a message:
When a chart has been refreshed, and its results displayed, the following are shown:
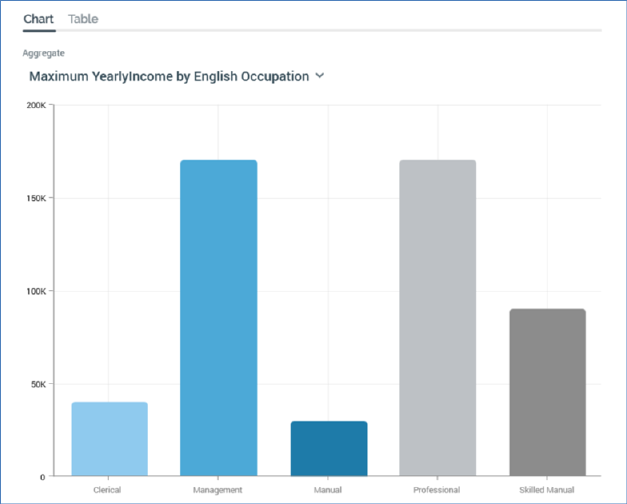
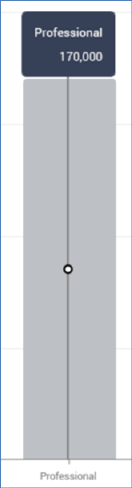
•Aggregate: if no Function attribute has been selected, or if only a single aggregate was checked, this is displayed as per the following example:
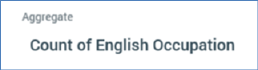
If more than one Aggregate is checked, a dropdown allows you to select the aggregate you wish to view in the chart:

When you change the displayed aggregate, the chart is refreshed accordingly
•Chart: results are displayed as a bar chart:
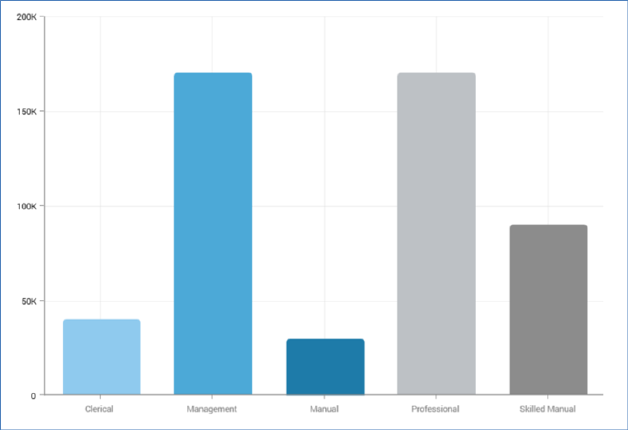
If no Function attribute was provided, or a Function attribute was provided and aggregate Count of Attribute Values was selected, the chart displays a simple count of Attribute values at the selected resolution level.
If a Function attribute was provided, and an aggregate other than Count of Attribute Values selected, the chart displays aggregated Function attribute values for each distinct Attribute value (also at the selected resolution level).
If translations have been provided for attribute values, they are rendered within a chart.
When you hover over a bar chart bar or pie chart segment, a tooltip describes that which the current context represents
When you open a chart, if results had been generated previously, the most recently-generated version thereof is displayed automatically at the panel. If the results are more than an hour old, an information icon is shown. A tooltip is shown on hovering over the same.