A number of line, bar and pie charts are shown in the Realtime Details Report. Each is documented separately.
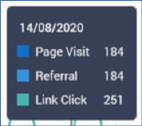
Information tooltips are shown when you hover over a chart.
Note that you can change the date range displayed within a chart by shortening or lengthening the horizontal scroll bar displayed at the bottom of the line chart manually, or by using the mouse wheel.