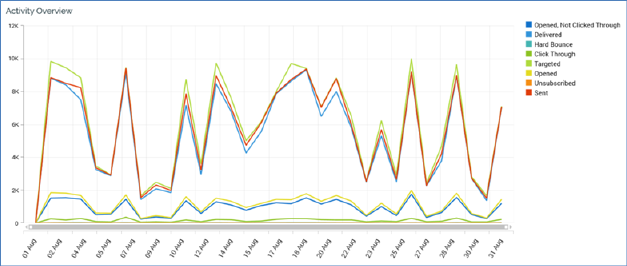
This line chart is displayed when an interaction activity is selected in the treeview. It displays results for the selected activity over time.